

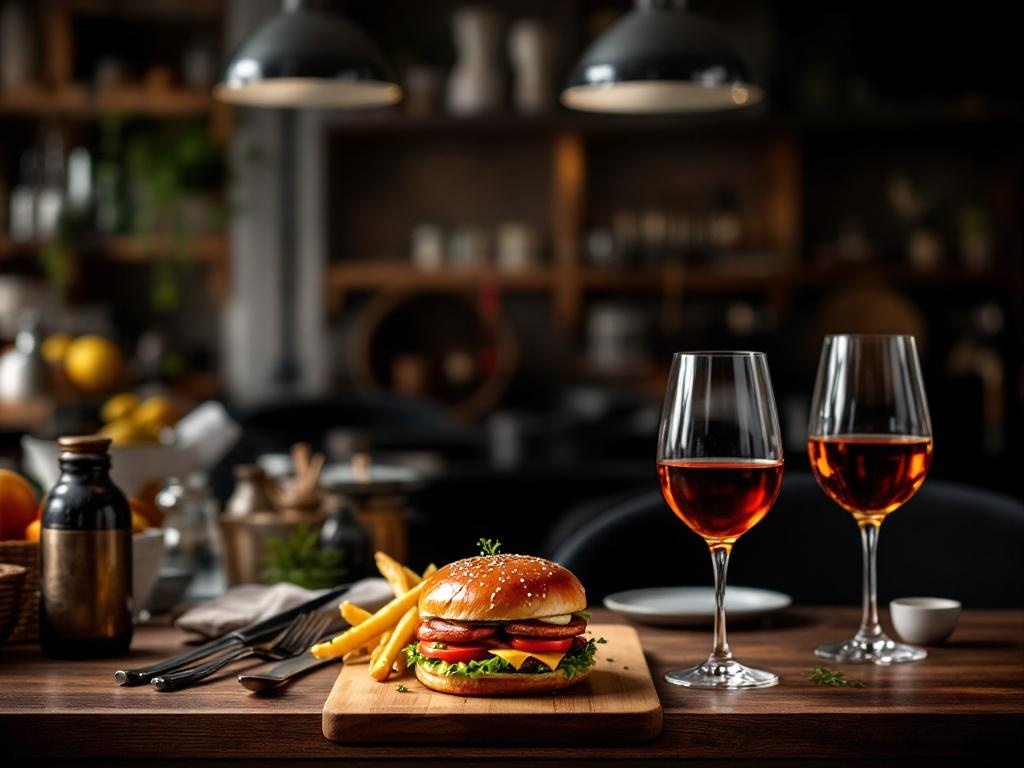

What Should Food Cost Be in a Restaurant?
Introduction
As restaurant operators navigate the ever-evolving landscape of the UK dining industry, one critical factor to consider is the appropriate food cost to maintain profitability and competitiveness. Striking the right balance between delivering quality culinary experiences and managing costs is essential for long-term success. In this article, we’ll explore the industry benchmarks, key factors influencing food costs, and strategies to optimise your restaurant’s food cost percentage.
Key Takeaways
- Standard food cost percentage for full-service restaurants is 28-35% of food sales
- Quick service restaurants average 30.5%, full-service 28.3%, and fast casual around 28.9-31.3%
- Inflation and rising food costs are top challenges for 91% of restaurant operators
- Prime cost (food + labour) should target 49% of sales, with labour averaging 30.5%
- Strategies like portion control, supplier negotiation, and menu engineering can help optimise food costs
Industry Benchmarks for Food Cost Percentage
In the UK restaurant industry, the standard food cost percentage for full-service establishments is typically between 28% to 35% of total food sales. This benchmark allows for adequate gross profit margins while accounting for the higher labour and overhead costs associated with full-service operations.
On the other hand, quick service restaurants (QSRs) average around 30.5%, full-service restaurants average 28.3%, and fast casual and pizza concepts tend to fall in the 28.9% to 31.3% range. Specialty concepts, such as steakhouses, may reach up to 35% due to the use of premium ingredients, while pasta-focused restaurants often hover around 28%.
The overall industry average food cost percentage ranges from 30% to 40%, with 30.5% being a commonly accepted benchmark for food sales.

Calculating Food Cost Percentage
The formula for calculating a restaurant’s food cost percentage is as follows:
Food Cost Percentage = (Beginning Inventory + Purchases – Ending Inventory) / Total Food Sales x 100
For example, if a restaurant has a food cost of £21,000 and total food sales of £60,000, the food cost percentage would be 35%. Alternatively, if the cost per dish is £1.50 and the menu price is £5.00, the food cost percentage would be 30%.
Let’s consider the case of Johnny’s Burger Bar. If they have a cost of goods sold (COGS) of £3,000 and total food sales of £8,000, their current food cost percentage is 37.5%. However, the ideal food cost percentage for their business model should be around 31%, which equates to a COGS of £2,500 against the £8,000 in sales.
Factors Influencing Target Food Costs
The target food cost percentage for a restaurant can vary depending on several factors, including the type of establishment, menu offerings, and regional or national economic conditions.
In 2025, 91% of UK restaurant operators reported that food cost inflation has significantly impacted their business, up from 82% the previous year. This challenge, coupled with rising food costs and tariff impacts, has forced many operators to re-evaluate their target food cost percentages. In fact, 2026 budgeting for the industry expects a 10% increase in food costs.
Prime Cost and Maximum Allowable Food Cost (MFC)
Another important metric to consider is prime cost, which is the sum of food cost and labour cost. The industry target for prime cost is typically around 49% of total sales. For example, if a restaurant has £65,000 in total sales, the prime cost should be £32,000 or less.
The labour cost percentage for the industry averages around 30.5%, with quick service restaurants at 29.4%, fast casual at 28.9%, casual dining at 33.2%, upscale casual at 30.4%, and pizza at 31.3%.
The Maximum Allowable Food Cost (MFC) is calculated as 100% minus the labour cost percentage, overhead percentage, and profit percentage. For example, if a restaurant has £15,000 in labour costs, £10,000 in overhead, and £7,000 in profit against £45,000 in total sales, the MFC would be 29%.
Strategies for Controlling and Optimising Food Costs
To control and optimise food costs, restaurant operators can employ various strategies:
- Closely monitor for waste and rising prices, and renegotiate supplier contracts to maintain competitive pricing
- Implement portion control measures to ensure consistent serving sizes and minimise waste
- Regularly review and engineer the menu to optimise profitability
- Utilise real-time data tracking software, such as Restaurant365, 7shifts, or Lightspeed, to monitor food costs and make informed decisions
- Benchmark your restaurant’s performance against industry standards to identify areas for improvement
Recent Trends and 2026 Outlook
The UK restaurant industry has seen menu prices increase by 3.7% year-over-year as of November 2024, with full-service restaurants experiencing a 4.3% increase and limited-service establishments a 3.0% increase.
Looking ahead to 2026, the industry expects a continued focus on sales growth and managing rising costs. Factors such as inconsistent traffic and the persistence of tariffs will likely contribute to the challenging environment.
Conclusion
Striking the right balance between delivering an exceptional dining experience and managing food costs is crucial for the success and profitability of UK restaurants. By understanding industry benchmarks, key factors influencing costs, and effective strategies for optimisation, restaurant operators can navigate the complex landscape and maximise their food cost percentage. By staying informed and proactive, you can position your restaurant for long-term sustainability and growth in the ever-evolving UK dining industry.
Sources:
Financial Models Lab: 7 Hot Pot Restaurant KPIs: Breakeven in 4 Months
Black Box Intelligence: Food Cost Percentage – Restaurant Glossary
7shifts: The Ultimate Guide to Restaurant Costs
Lightspeed: How to Calculate Food Cost Percentage (With Examples)
National Restaurant Association: Menu Prices | Economic Indicators
Restaurant365: How to Calculate Food Cost Percentage and Margins
PR Newswire: Restaurant365’s 2026 Industry Survey Outlines Key Sales and Cost Trends
Bloom Intelligence: RESTAURANT BENCHMARKS
Restaurant365: R365 2026 Industry Survey Outlines Key Sales and Cost Trends
NetSuite: Top 11 Benchmark KPIs Every Restaurant Owner Should Measure
HigherMe: The Simplified Guide to Restaurant Benchmarks
Vanguard Food and Beverage Thynk Tank: Restaurants & Hotels Are Budgeting For Higher Costs In 2026
Cuboh: How to Calculate the Restaurant Benchmarks You Need to





Leave a Comment